![]()
|
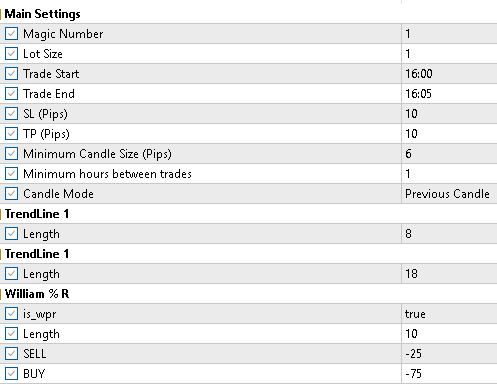
Optimisation & Backtesting MetaTrader includes a 'Strategy Tester' in MT4 and in MT5. They work slightly differently because with MT5 you can pay to use use 'Agents' which are basically computers in the cloud which share the load and so greatly speed things up. However, backtesting can easily be done on your own computer' However, on a weak VPS it will run much slower and you may even get 'out of memory' messages and have to restart your MT5. On a good VPS it is not a problem but you will be far better off running it from the desktop of your own computer as even an old, modest one will be a lot better than a VPS. My experience has been that even experts do not know how to run backtesting properly! For example, I know an EA seller who has 4 high powered computers (he uses MT4) running backtests 24 hours a day - yes really. But I had to point out to him that looking for the highest profits was not the best thing to do. After all, which is better - $1,000 profit with $800 drawdown or $500 profit with $200 drawdown? Obviously the later because you can use 3 times the Lot size and 3 times $500 is a lot more than £1,000 and you have a smaller $600 drawdown. Just as important is the smoothness of the profit graph. It's no good having huge gains one month and losses the nest - if you start running the EA with those settings and hit a bad month right away you will stop trading! We need a consistent return, week after week (even if it is less profit). The last factor to consider is the duration of the backtest. I'm writing at the beginning of December 2024 and since we are trading from the M1 charts we only need to backtest for a month or two. If we were trading the Daily charts, at least 3 months would be needed. It's a stupid idea to backtest for a year or two as conditions change every few months... So, the bottom line is we must look for a good profit to drawdown ratio, a smooth profit graph and steady growth even under the different conditions during our short 1 or at most 2 month test period. Optimise for fantastic profits over the last 1 month and you may end up with losses when you start live trading. Also, psychologically, it is better to restrict the number of consecutive losses to two or preferably just one. If you hit 3 losses in a row, you will probably stop trading those settings from fear of a fourth loss! This is one reason it is better to use a larger Stop Loss rather than the tightest possible. Best to find the optimum SL and add a pip - also best to find the optimum TP and subtract a pip.You will be much happier with one 10 pip loss than four five pip losses. I would never use an SL smaller than 6 pips for our M1 Gold. Strategy Tester is accessed from the View menu and opens up at the bottom. Drag the window up to make it as big as possible. It should open up with the 'Overview' tab - select 'Single' which will take you to the Settings tab. Use M1 and select Gold. We will use $50,000 capital and 1:50 leverage (not really important) and Modelling 'Every tick'. Of course, we must select RichLazyGold for the EA at the top! Select the dates for testing use the current date for the end and a month or 6 weeks before for the start date. Now we need to go to the Inputs tab and input suitable starting parameters. I suggest using the ones below and best to save them as TestStart so you can use them again very easily. Run a single test manually changing the Start Time from 02:00 to 22:00 and the End Time 5 minutes later. These are basic good settings. Note down the best profitable times - we will use 16:00.
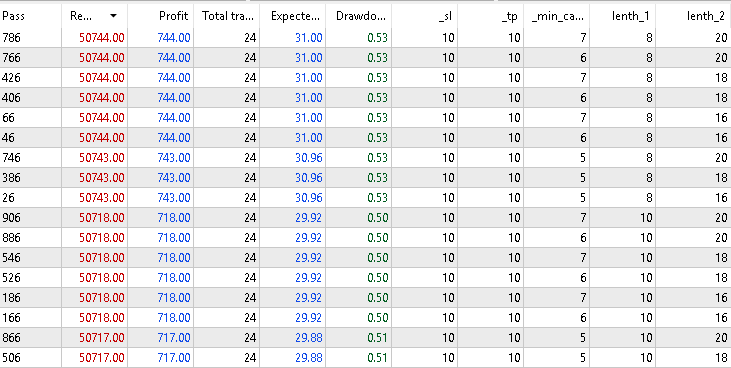
Press Start bottom right and on my VPS each run only takes 3 or 4 seconds (after downloading all the data and doing one run). Now we are going to optimise the 16:00 backtest. Look in the Backtest tab to see the results. With these basic settings, I get $744 profit with £264 drawdown and 2 consecutive losses totalling $201 - a pretty good result! Look in the Graph tab to see whether it is a smooth one - not bad for the last half but flat for the first half. Go back to Overview and click Complete Optimisation. For the first run, use the below settings. Only tick the required test parameter and fill in the Start, Step and Stop columns. This gives us quite a high total of 1080 passes which takes about 20 minutes on a VPS. Unfortunately for this explanation, the results are no better than for the first run! Normally we would find some big improvements. However, if look down to about half way you will see a slightly improved drawdown of 0.50% as opposed to 0.53% - note this is on $50k with a small 1 Lot size.
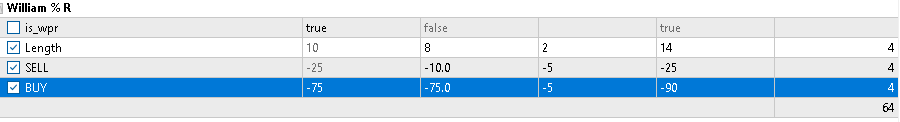
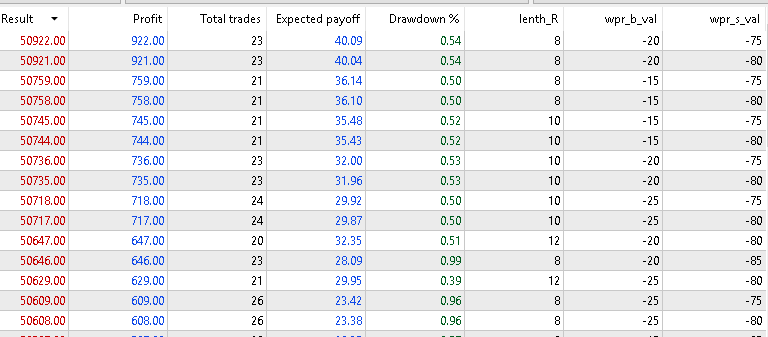
So let's choose pass 526 with 10 and 18 Trendlines (it is best to choose the shortest longer one as this will trigger quicker. Next we would Right Click on the ones we want to examine further and 'Run Single Test' to see how smooth the profit graph is. In this case with little variation, we only have the single choice. Finally, we optimise the Williams Percentage R to see if we can find an improvement. Go back to Overview and select Complet Optimisation again (it will have changed to Single). Back to inputs and untick everything. Go down to W%R and change it to these parameters with just those boxes ticked. Then click Start and run this test. Now we have some improvements! I would choose the 2nd one down because -20 and -80 are symmetrical. Lastly, Right click on that row and 'Run Single Test' to see if the Graph is acceptable smooth. Lastly, adjust the Lot size for you capital so that the drawdown is acceptable (under 20%).
Once you have found a good setting, click on the Settings tab and again on the Settings icon (a gear) next to the IDE button) and Save to your desktop for use in your real trading. The IDE button is only for use with source files to access the code.
|